


Tata Silver Exchange Traded Fund
ETFOther Schemes - Exchange Traded Fund

- Returns
- +55.45%
- AUM
- ₹5,181.58 Cr
- Inception
- 12 Jan 2024
- NAV
- ₹21.30

₹384.27
as on 09 Oct 2026Tata Value Fund follows the value-conscious style of investing. The Scheme aims to invest at least 70% of its assets in companies which, at the time of investment, have a rolling twelve month P/E ratio lower as compared with the rolling twelve month P/E ratio of the BSE Sensex. Buying good companies at an attractive P/E ratio is a good discipline, but clearly not the only anchor. The Fund uses several other qualitative and quantitative screens to buy companies. The Fund strives to “buy good stocks at cheap valuations and not “cheap” stocks”.
Tata Value Fund is a growth-oriented value fund. The fund seeks growth within stocks identified as value
1. On or before 30 days from the date of allotment: 0.50%.
2. After 30 days from the date of allotment: NIL.
₹ 100
Lumpsum
₹ 5,000
₹100
₹ 10 Lakhs
Worth of investments in last
This Fund
N.A.
0%
Nifty 500 TRI
N.A.
0%
Nifty 50 TRI
N.A.
0%
| Key Measures** | Fund | Benchmark |
|---|---|---|
| Standard Deviation | 15.39 | 13.16 |
| Sharpe Ratio | 0.58 | 0.57 |
| Portfolio Beta | 0.92 | NA |
| R Squared | 0.65 | NA |
| Treynor | 0.81 | NA |
| Jenson | 0.17 | NA |
| Current value of ₹10,000 invested | ||||||
|---|---|---|---|---|---|---|
| Annualized (%) | Nifty 500 TRIBenchmark(%) | Nifty 50 TRIAdditional Benchmark(%) | Scheme | Nifty 500 TRIBenchmark(%) | Nifty 50 TRIAdditional Benchmark(%) | |
Since Inception 29 Jun 2004 | 16.44% | 13.57% | 12.13% | ₹80,126 | ₹56,958 | ₹47,811 |
| Last 1 Year | 8.05% | 5.31% | -0.35% | ₹10,809 | ₹10,534 | ₹9,965 |
| Last 3 Years | 14.88% | 12.54% | 8.99% | ₹15,168 | ₹14,257 | ₹12,951 |
| Last 5 Years | 14.56% | 11.12% | 8.32% | ₹19,742 | ₹16,946 | ₹14,915 |

Managing since 01 Apr 2016
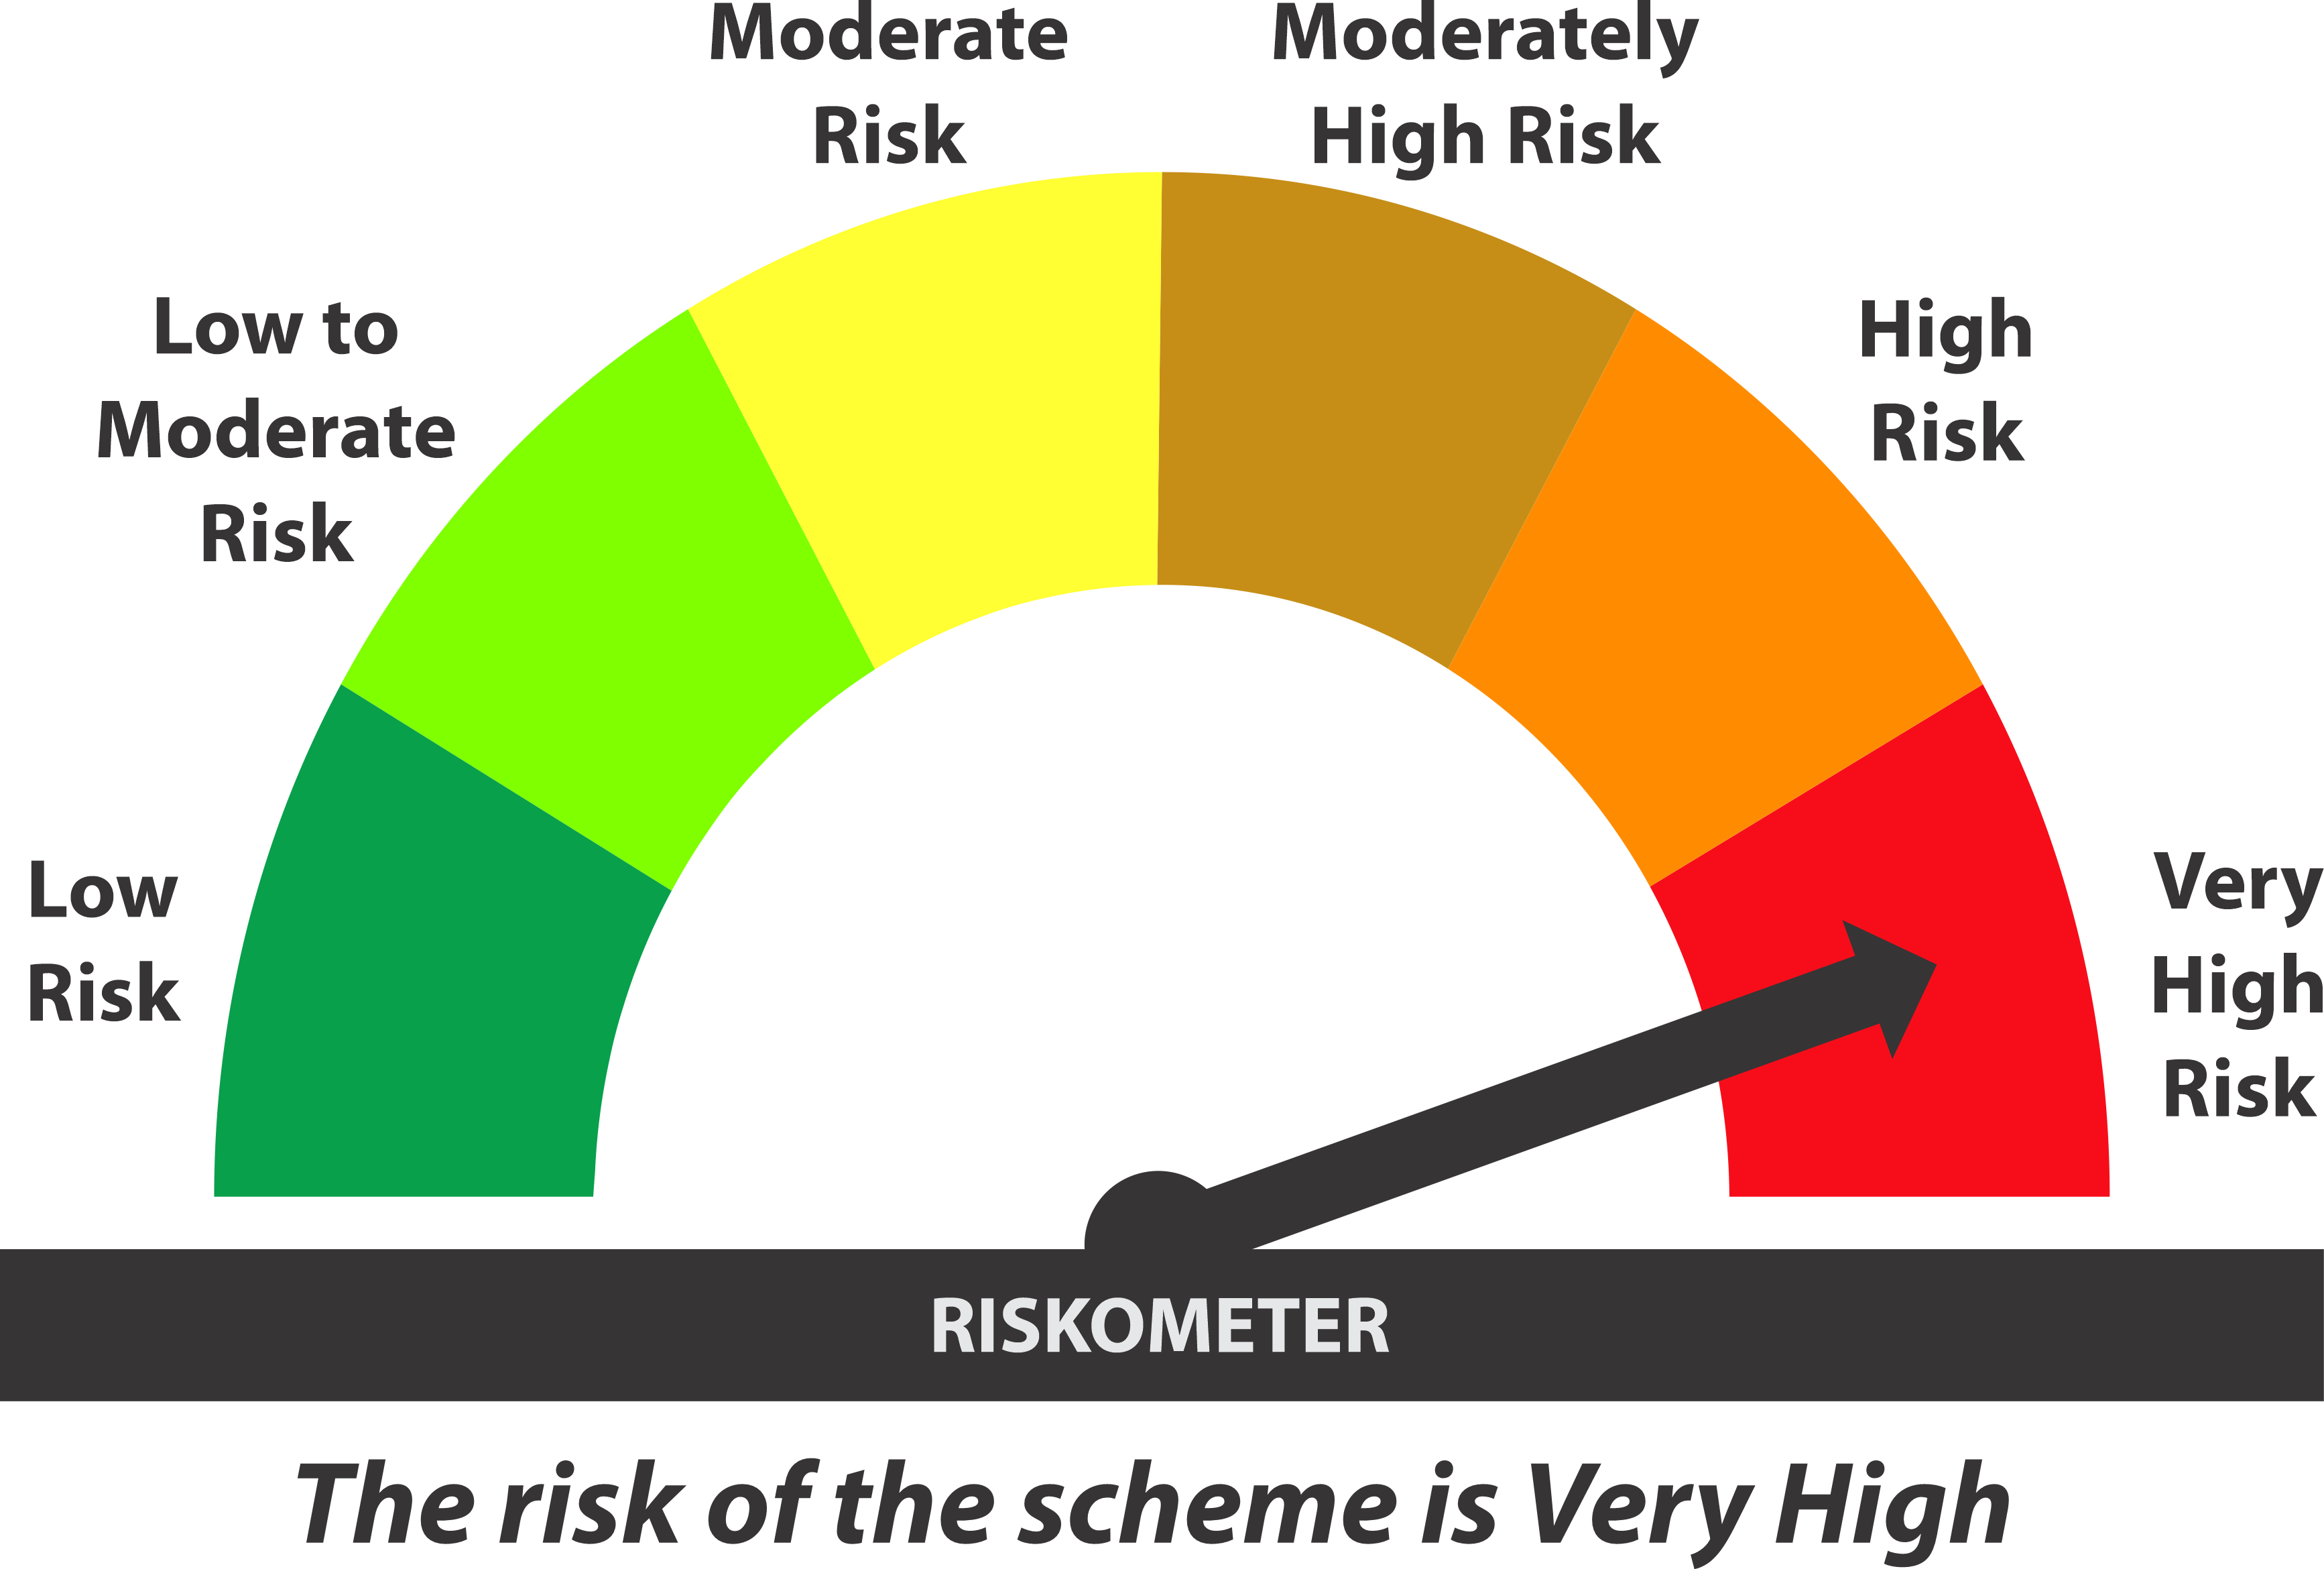
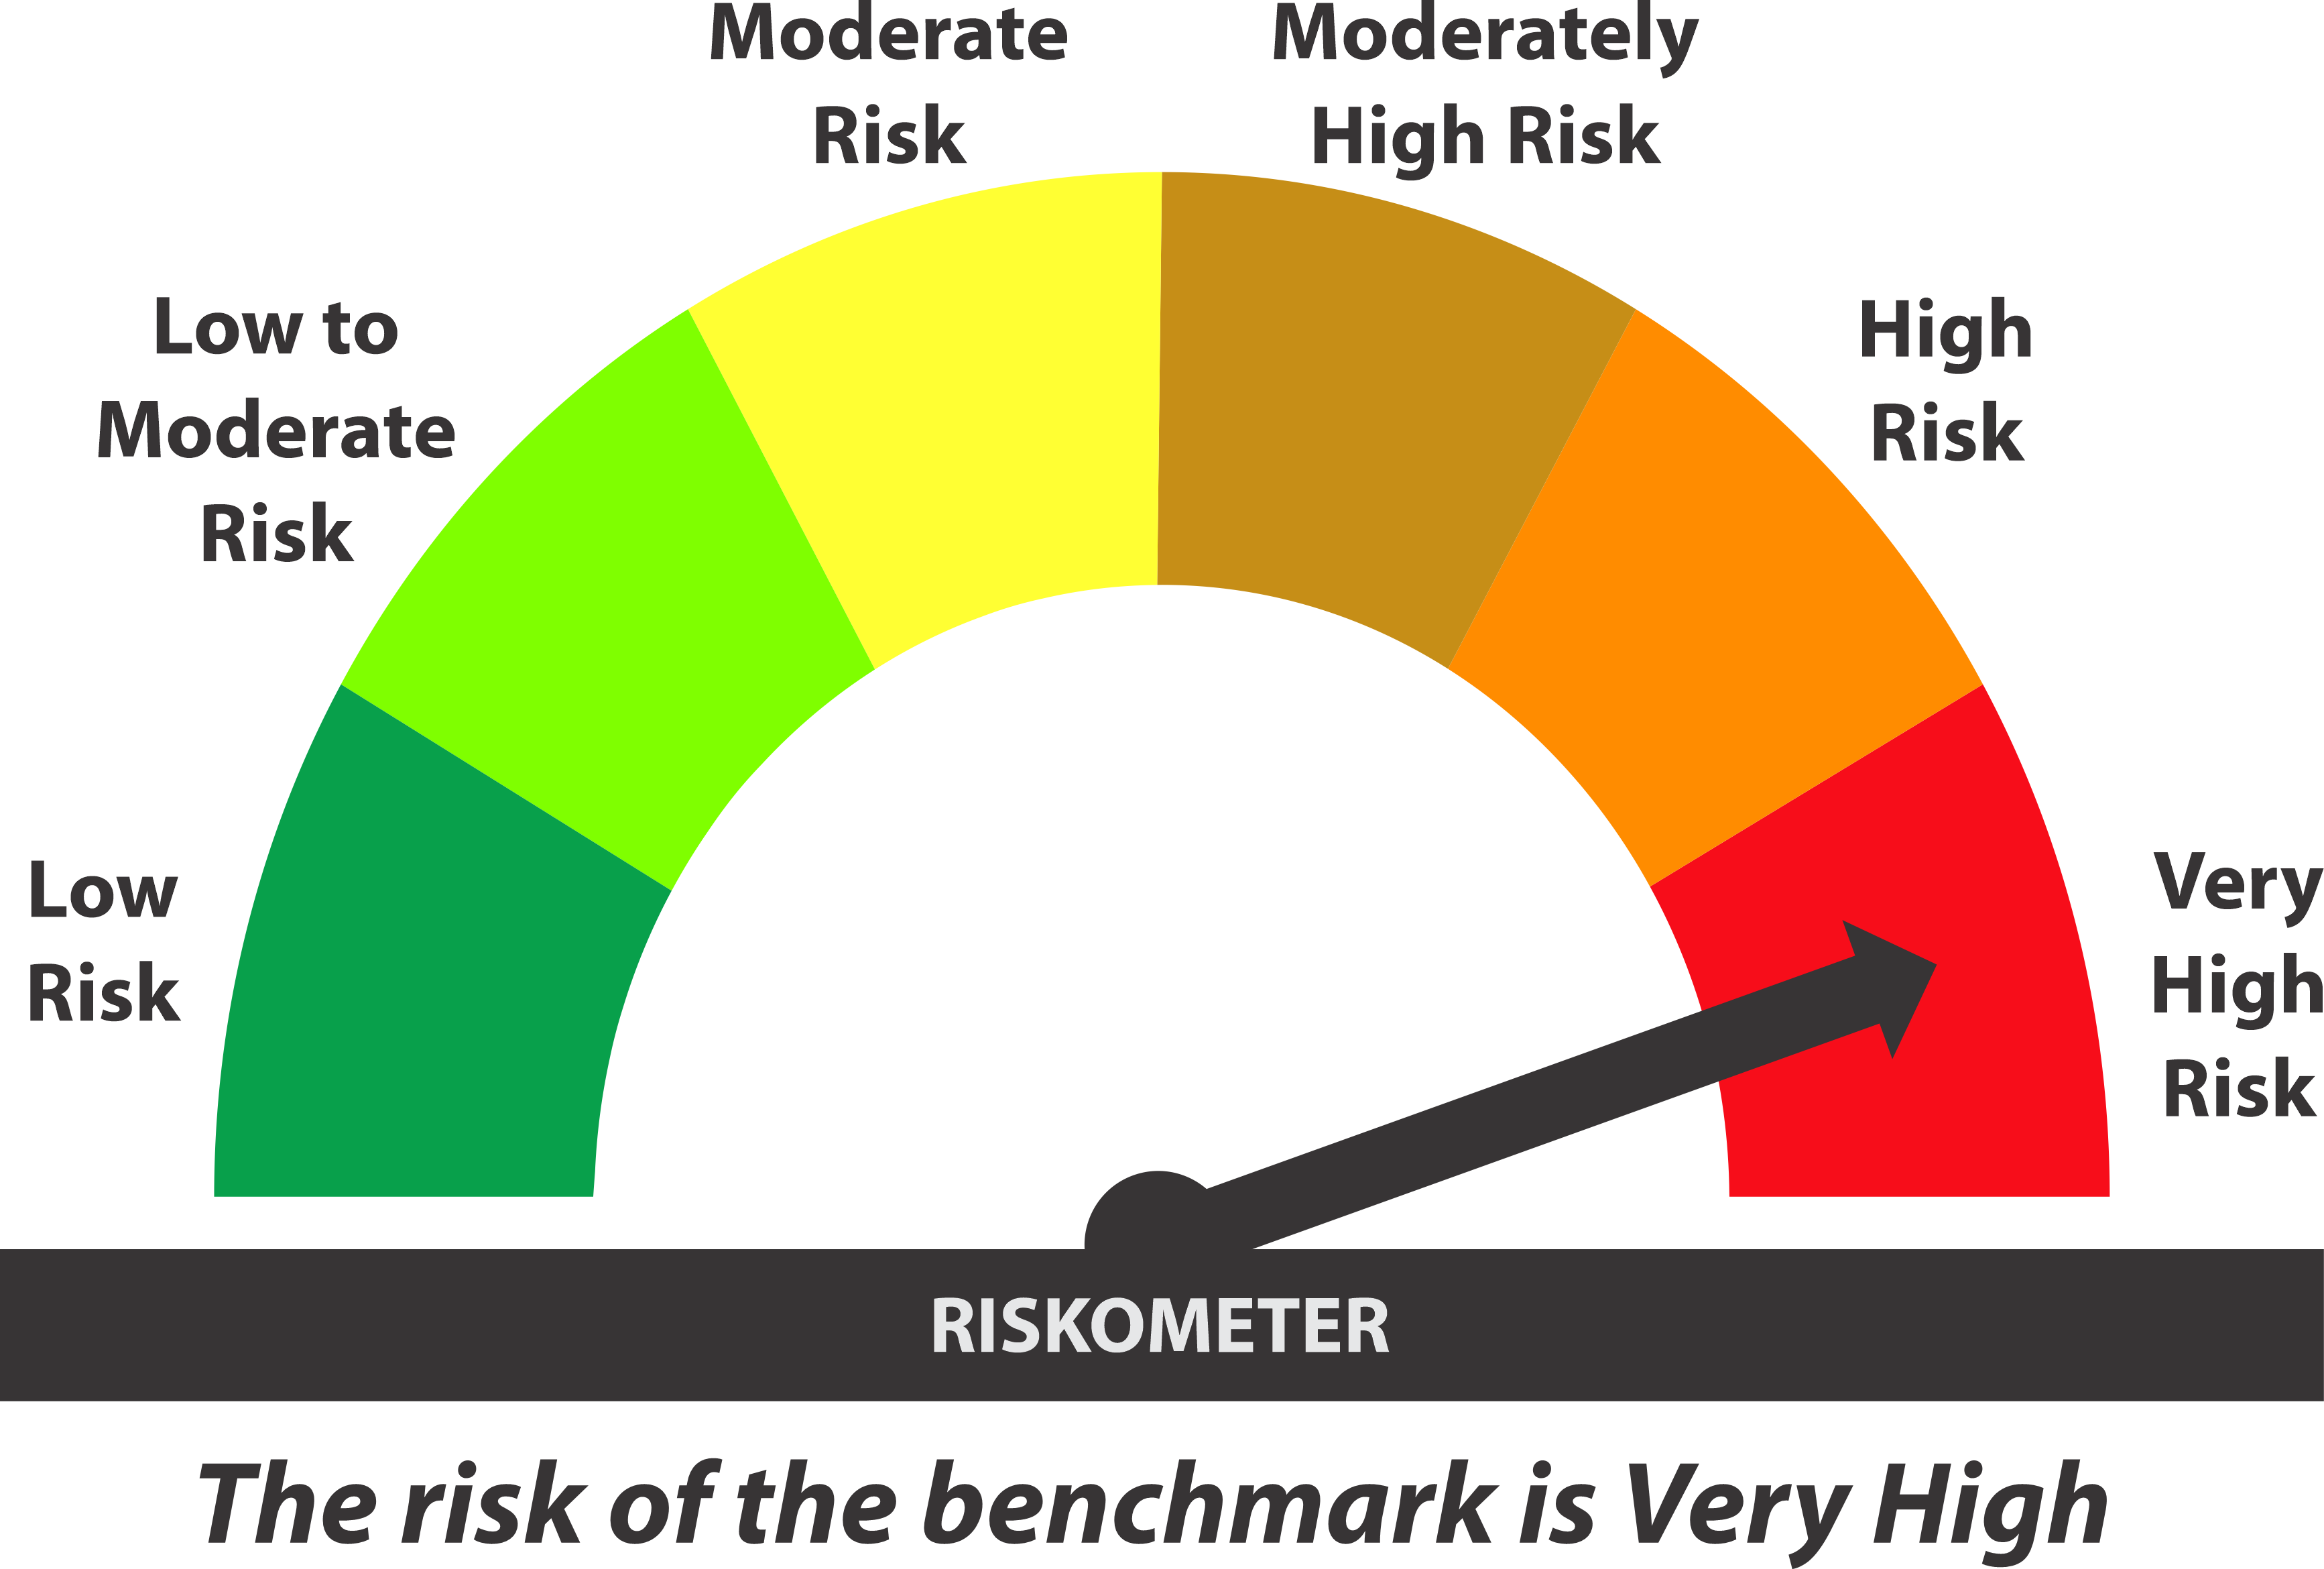
** Investors should understand that their principal will be at Very High risk